Enrollment
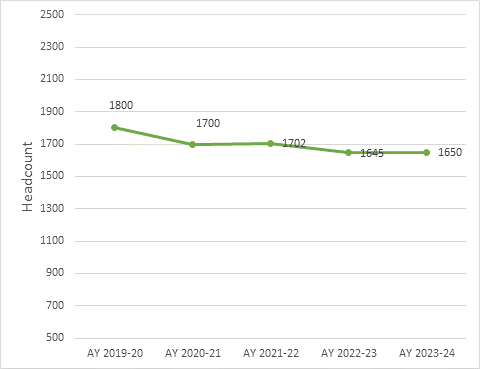
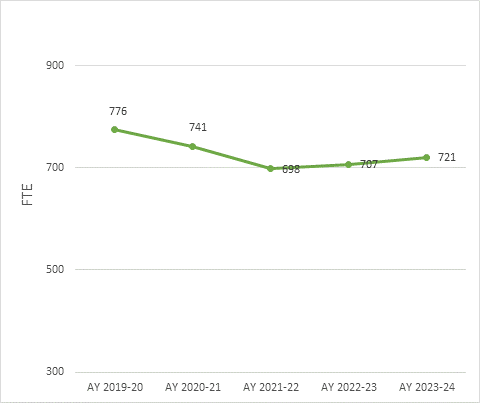
Paul D. Camp Community College (Camp) is the third smallest community college in the Virginia Community College System (VCCS). In 2023-24, 1,650 students attended Camp, either at one of its campuses, on-line or through Dual Enrollment.
Additional data and figures can be found in Camp’s Fact Book.
Demographics
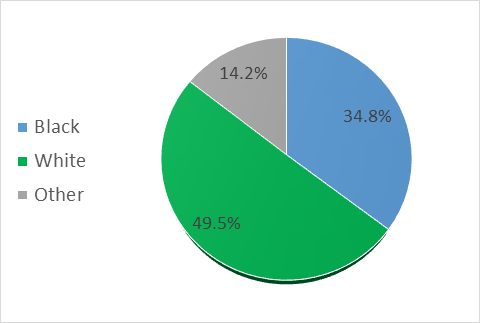
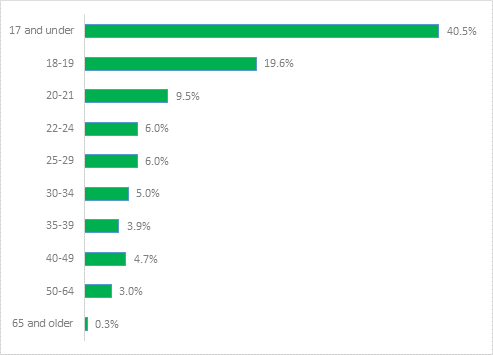
Paul D. Camp Community College’s (Camp) student body is predominately female (64%). About 50% are white and 35% identity as Black. Due in part to Camp’s Dual Enrollment population, the overall student population has gotten younger over the last five years, with 71% of all student under the age of 22. In addition, approximately 20% of Camp’s student body is considered first generation, meaning that neither the student’s mother nor father attended college.
Awards/Graduates
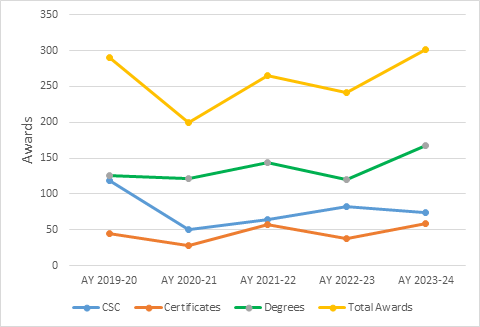
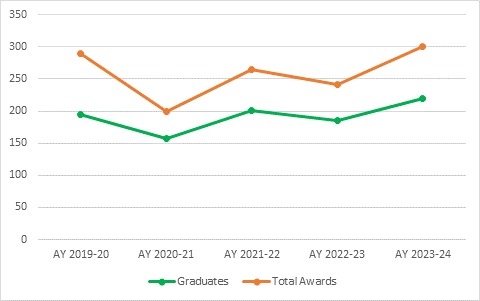
Paul D. Camp Community College (Camp) awards degrees, certificate, and career studies certificate three times a year (summer, winter, and spring).