
OIE provides data on student success such as retention rates, course completion rates, graduation rates, and transfer rates. The data is used to implement strategies to improve performance.
In accordance with disclosure requirements set forth by the Council on Higher Education Accreditation and the Southern Association of Colleges and Schools Commission on Colleges, Camp makes available its Statement of Goals for Student Achievement and Success of Students in Achieving These Goals. Questions about this statement may be addressed to the Office of the Vice President of Academic and Student Development. The documents below present additional information on Camp’s retention rates, grade distributions, graduation rates, and transfer rates.
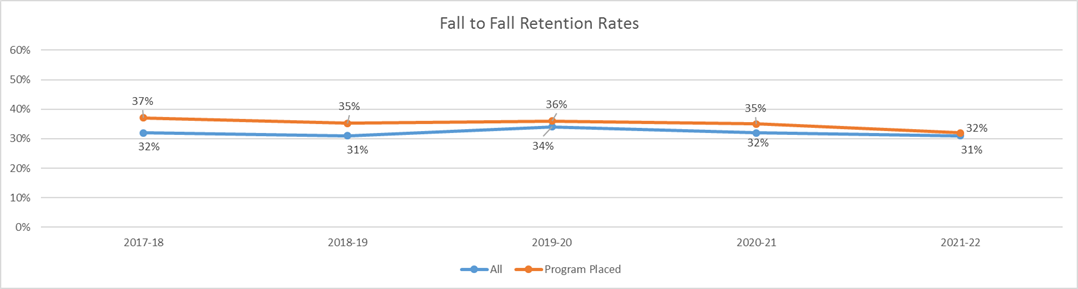
Retention Rates
Retaining students is key to student success and ensuring student completion. Fall to fall retention rates for the last five years are presented below.
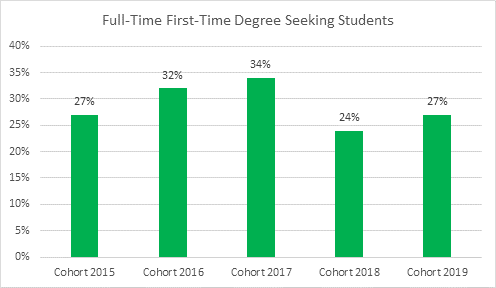
Camp also reports to IPEDS, through the Fall Enrollment Survey, cohort retention data for first-time degree and/or certificate seeking students. For the Fall 2021 cohort, 54% of first-time, full-time students were retained in Fall 2022 and 36% of the first-time part-time students were retained.
IPEDS Graduate Rates
Graduation rates are the percentage of first-time, full-time students in a cohort who complete their program within 150% of normal time. This means 3 years for an associate degree and various scheduled times for certificate and career studies certificates.
The graduation rate for the Fall 2019 cohort was 27%, 23% for Men and 34% for Women. The transfer-out rate for Camp for the Fall 2019 cohort was 11%, 14% for Men and 9% for Women.
Below is the disaggregated Student Right-to-Know Graduation Rates for the Fall 2019 Cohort
| Race/Ethnicity | Graduation Rate |
|---|---|
| American Indian or Alaska Native | 0% |
| Asian | - |
| Black or African American | 10% |
| Native Hawaiian/Pacific Islander | - |
| Hispanic/Latino | 40% |
| White | 36% |
| Two or More Races | 50% |
| Race/ethnicity Unknown | 33% |
| Gender | Graduation Rate |
| Female | 22% |
| Male | 34% |
| Financial Aid | Graduation Rate |
| Pell Grant Recipient | 25% |
| Direct Subsidized Loan Recipient, but no Pell | 9% |
| Did not Receive Pell or Direct Subsidized Loan | 37% |
| Total Cohort | 27% |